How it works
From importing the log to ready-to-apply settings. Here's the complete journey, illustrated with a real analysis.
Import your Blackbox log
Plug your flight controller into Mass Storage (one click via MSP) or drop in a .BBL / .BFL file. Decoding happens locally — no data leaves your browser.
Pick the drone type and run the analysis
Each detected session shows its duration, date and frame count. Select the drone class (it's auto-detected and remembered), then click Analyze.
Read the recommendations and apply them
The report prioritizes what matters: dominant problem, P1 changes to apply first, then P2 adjustments. Grab the CLI script, re-fly, and compare.
What you get after analysis
The analysis is organized into four tabs, from the most concrete to the most detailed.
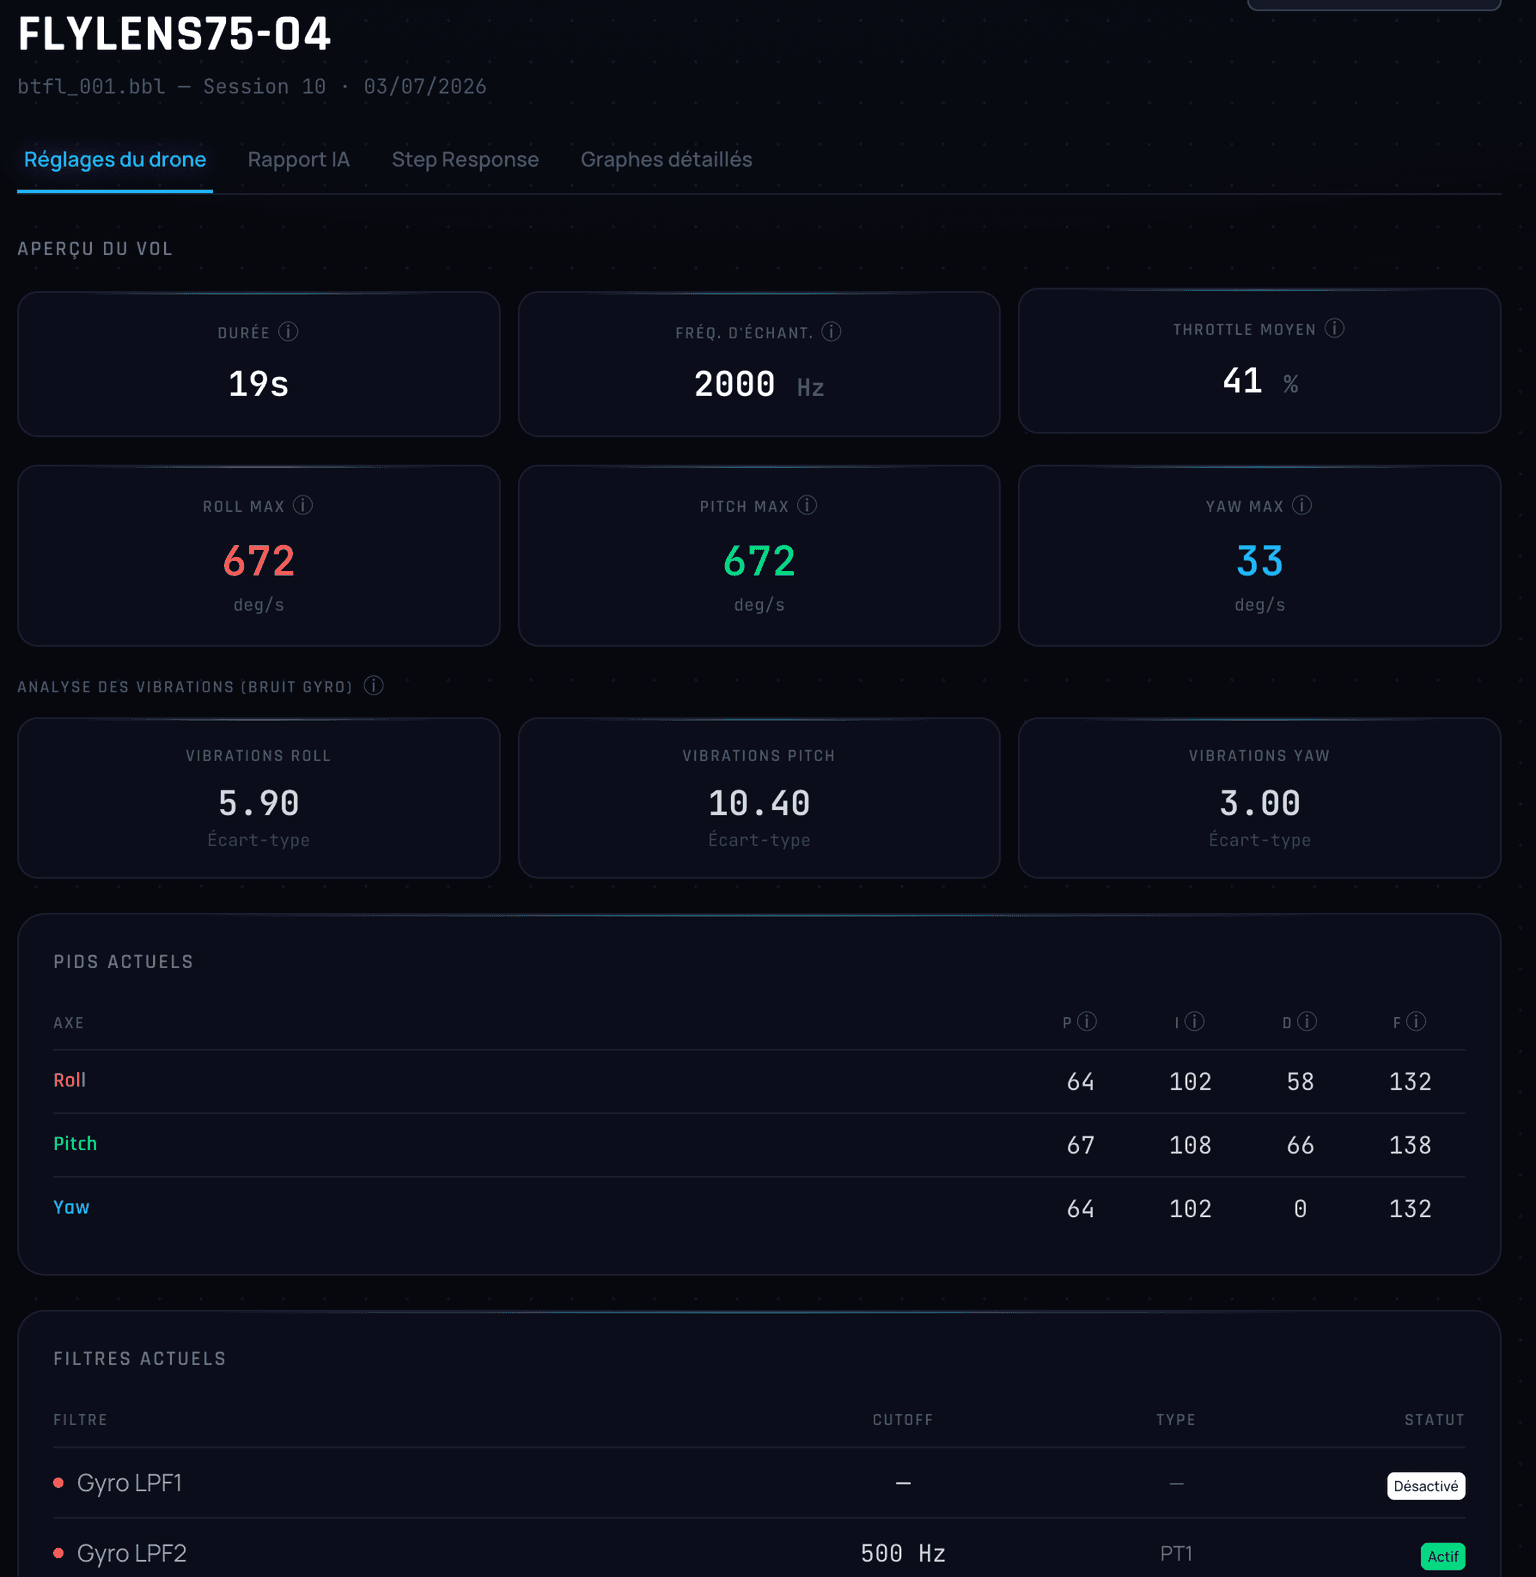
Drone settings
A flight overview — duration, sample rate, average throttle, max deflection per axis — and gyro vibration analysis. Below it, your current PIDs and filters as read from the log, so you start from a clear baseline.
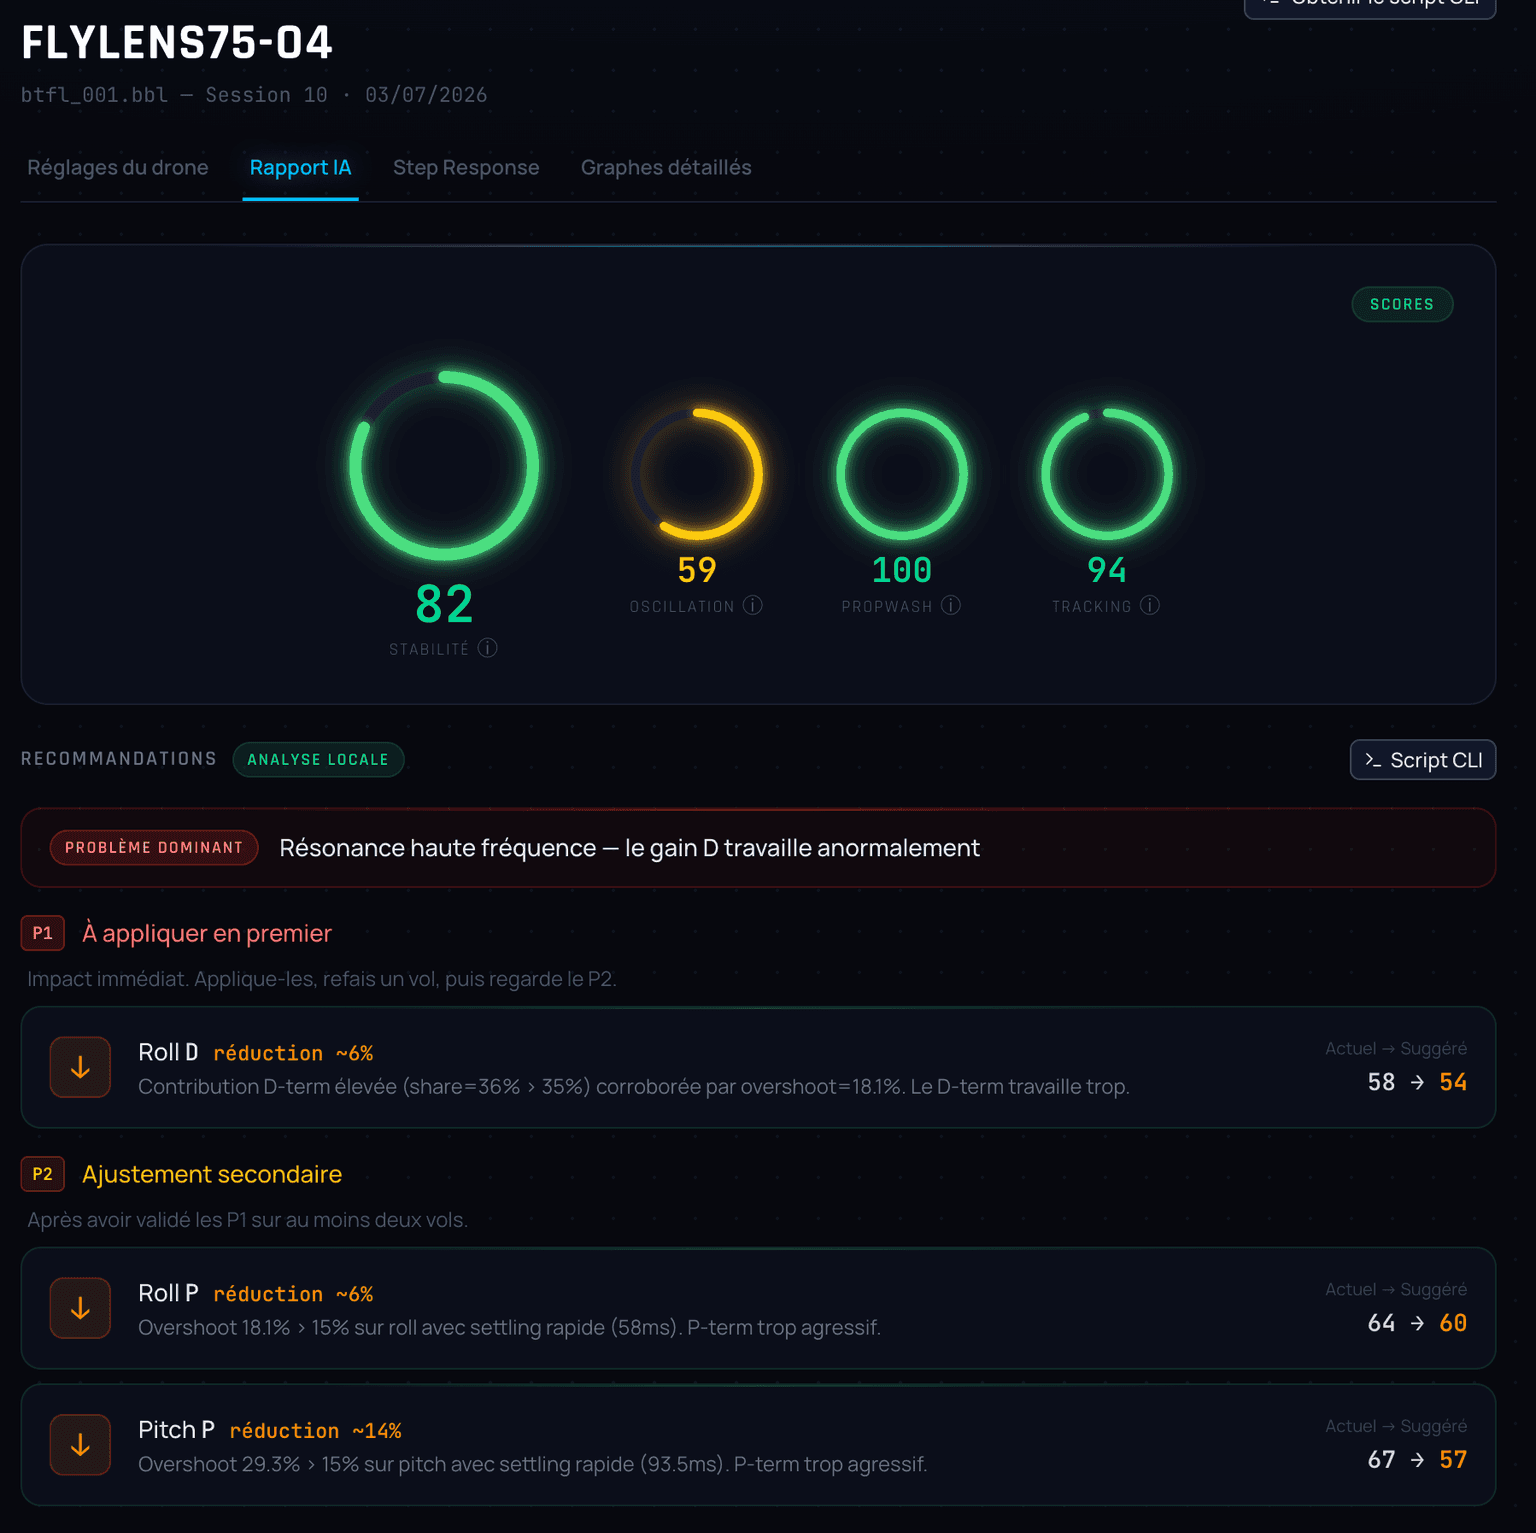
AI Report
The heart of the tool. Four scores (stability, oscillation, propwash, tracking) summarize flight quality. The dominant problem pinpoints the most impactful defect, then recommendations are prioritized : P1 to apply first, then P2 as a secondary adjustment, each with the current → suggested value. One click on CLI Script generates ready-to-paste commands.
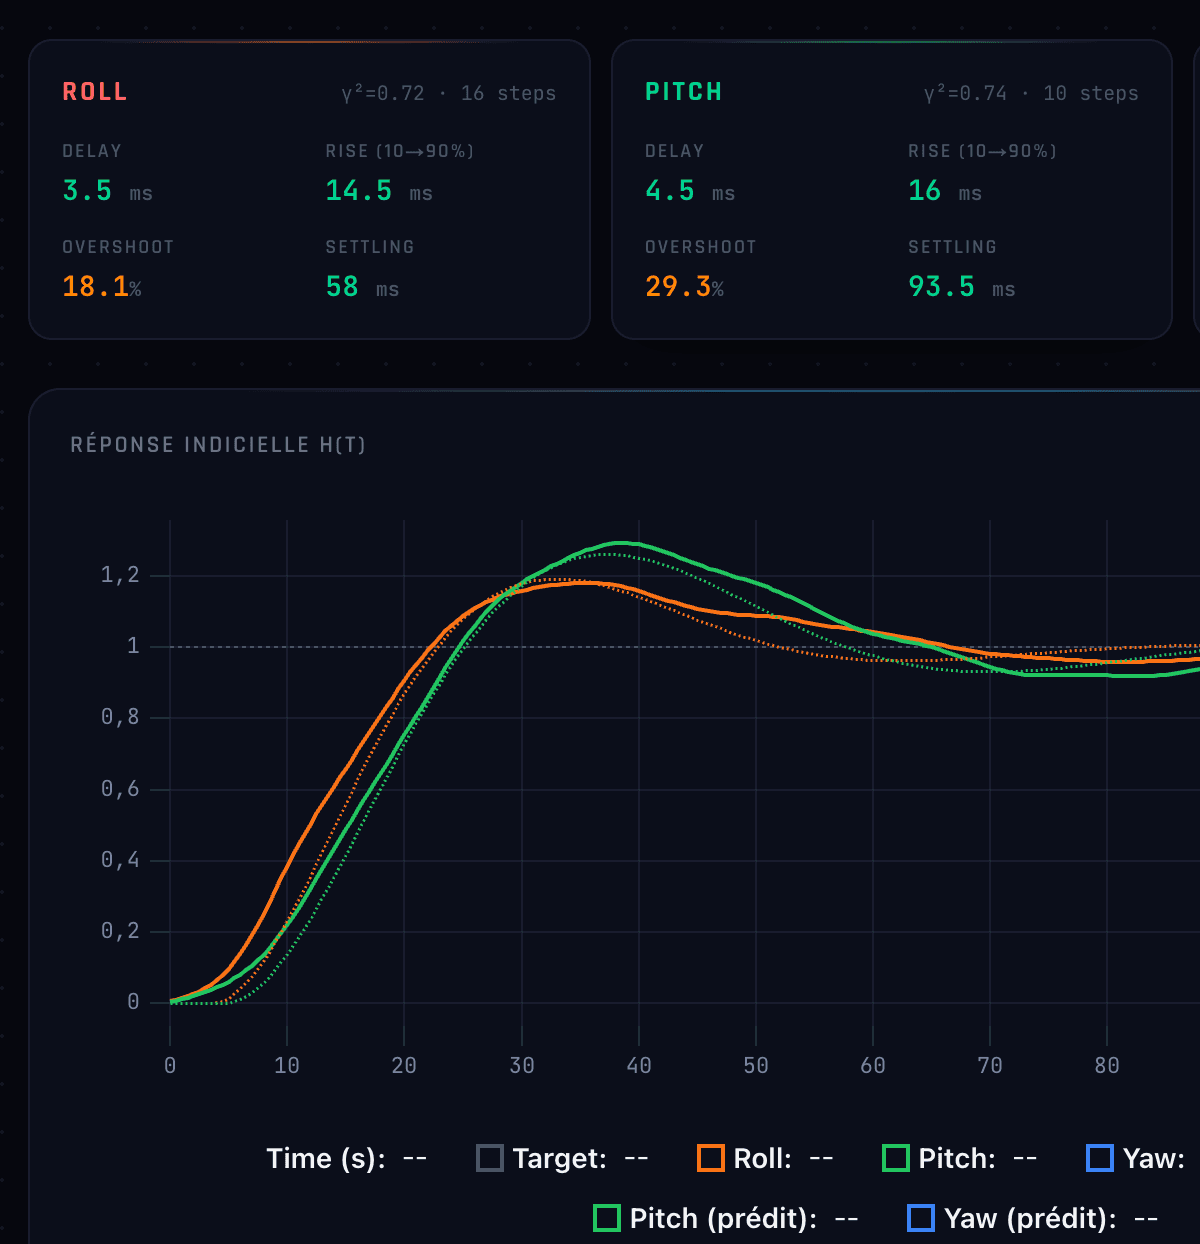
Step Response
The step response per axis : delay, rise time, overshoot and settling. It's the signature of your tune — high overshoot betrays an overly aggressive P or D. The curve overlays the measured response and, if you simulate a change, the predicted response.
Detailed graphs
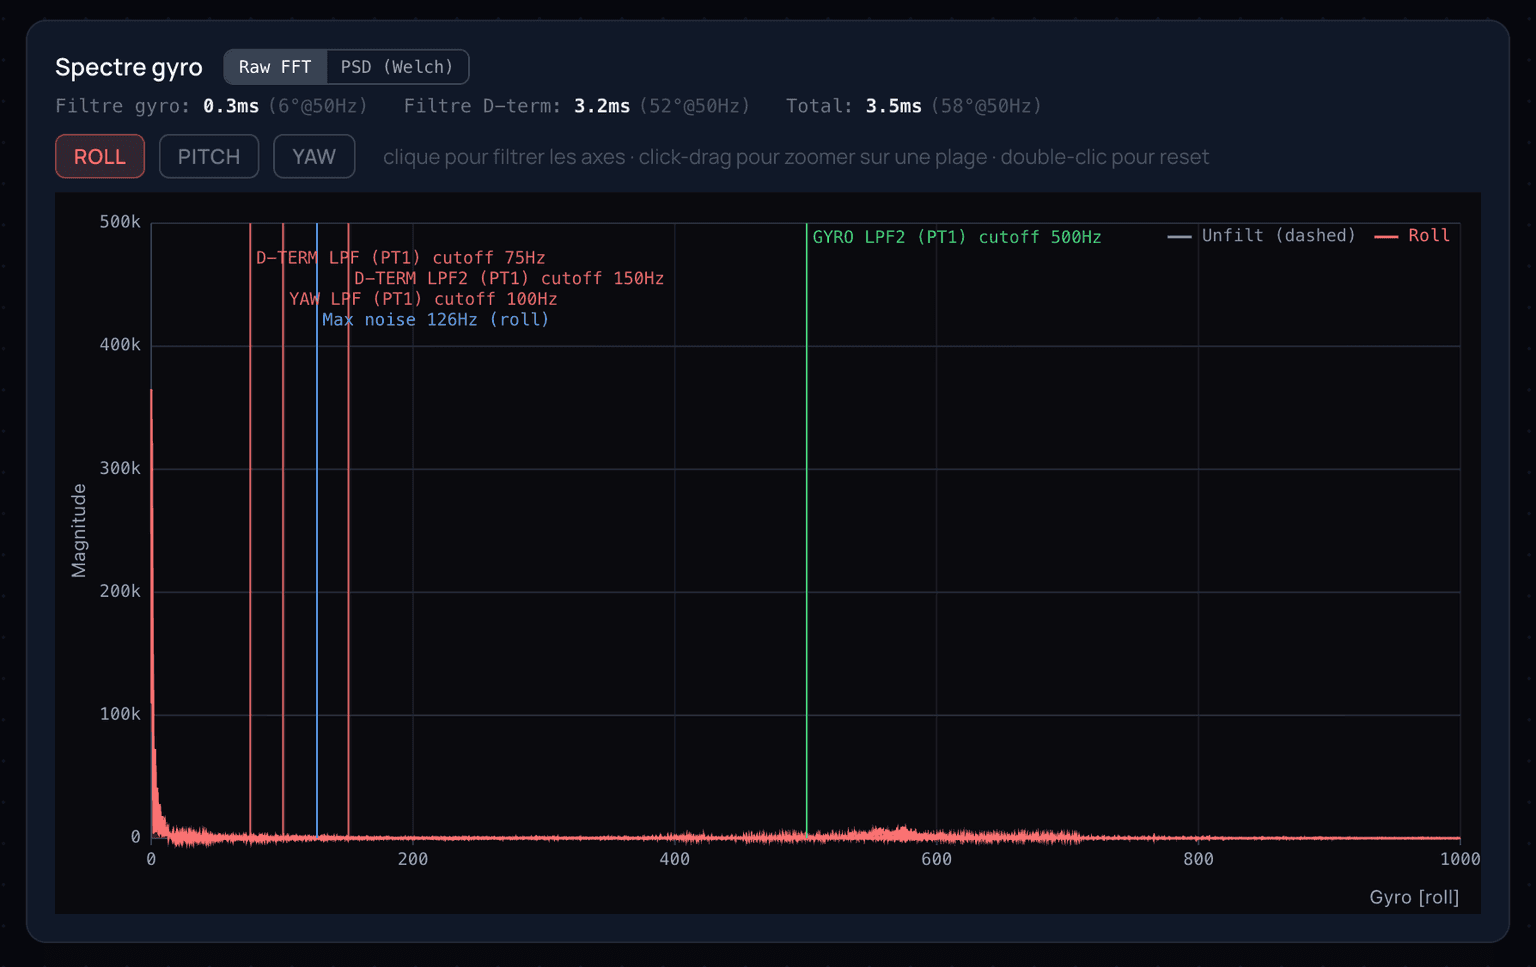
To go further : the gyro spectrum (raw FFT or Welch PSD) with your filter cutoffs overlaid and the detected noise peak. Ideal for checking a filter cuts in the right place. Click-drag to zoom, filter by axis.
100 % local
All decoding and analysis run in your browser. Your flight logs are never uploaded. The AI only steps in — with your own provider — to rephrase the already-computed analysis in plain language.
Ready to see the report for your own drone ?